EPA's Bush-era sea level rise study, part 1.
Background Documents Supporting Climate Change Science Program Synthesis and Assessment Product 4.1: Coastal Elevations and Sensitivity to Sea Level Rise
Edited by James G. Titus and Elizabeth M. Strange. 2008. Washington, D.C.: U.S. Environmental Protection Agency. EPA 430-R-07-004.
During 2000-2008, EPA began an effort to update the 1988 Report to Congress, which estimated the nationwide area of dry land and wetlands potentially lost to a rising sea, the cost of holding back the sea, and the value of lost land, structures, and wetlands. The Report to Congress (as well as a journal article about the cost of sea level rise) was based largely on a sample of 48 coastal sites, crude topographic data, and simplistic assumptions about shore protection and the ability of wetlands to keep pace with rising sea level. This effort, by contrast, used best-available elevation data, site-specific assessments of wetland accretion by expert wetland scientists, and shore protection assumptions based on land use data, government development and shore protection policies, and site-specific assessment by county planners from 130 local governments.
The effort is not yet complete--and the completed portions have not all been published. But EPA did publish part of the study in 2008. You can download the full report (PDF) (354 pp., 11,675 KB) or individual sections, or read the preface on this page below the Table of Contents.
TABLE OF CONTENTS
Preface
Preface and front matter (PDF) (10 pp., 157 KB)
Chapter 1: Coastal Elevations in the Mid-Atlantic
Maps of Lands Close to Sea Level along the Mid-Atlantic Coast (PDF) (44 pp., 2,150 KB) by J. G. Titus and J. Wang – A coastal elevation data set for the Mid-Atlantic for purposes of assessing the potential for coastal lands to be inundated by rising sea level.
Interpolating Elevations (PDF) (23 pp., 820 KB) by R. Jones and J. Wang – Methods used to quantify the area of land close to sea level.
Uncertainty Ranges (PDF) (66 pp., 962 KB) by J. G. Titus and D. Cacela – Uncertainty ranges for estimates of the amount of land close to sea level.
Chapter 2: Wetlands Accretion in the Mid-Atlantic
Site-Specific Scenarios for Wetlands Accretion in the Mid-Atlantic Region (PDF) (41 pp., 4,301 KB) by D. J. Reed, D. A. Bishara, D. R. Cahoon, J. Donnelly, M. Kearney, A. S. Kolker, L. L. Leonard, R. A. Orson, J. C. Stevenson – An expert panel assessment of how Mid-Atlantic coastal wetlands would respond to changes associated with three sea level rise scenarios.
Maps that Depict Site-Specific Scenarios for Wetland Accretion in the Mid-Atlantic Region (PDF) (12 pp., 1,013 KB) by J.G. Titus, R. Jones, R. Streeter – Maps and a data set depicting a set of site-specific assumptions for wetland vertical accretion developed by a panel of wetland scientists.
Chapter 3: Mid-Atlantic Coastal Habitats and Environmental Implications of Sea Level Rise
Overview (PDF) (24 pp., 933 KB) by A. Shellenbarger Jones – Discussion of species and habitats of the Mid-Atlantic from New York to Virginia that are at risk from sea level rise.
New York to Virginia - Discussions by various authors of species and habitats of the Mid-Atlantic from New York to Virginia that are at risk from sea level rise. Or download the entire set (PDF) (51 pp., 1,115 KB)
Chesapeake Bay - Discussion of species and habitats of the Chesapeake Bay that are at risk from sea level rise. Or download the entire set (PDF) (39 pp., 294 KB)
Sea Level Rise Modeling Study (PDF) (42 pp., 2,032 KB) by R. Jones and E. M. Strange - A pilot study of coastal Ocean County, New Jersey, which develops and applies methods for evaluating risks to coastal ecosystems under various sea level rise and armoring scenarios.
PREFACE
Sea level has risen approximately 30 cm (1 foot) along most of the U.S. Atlantic and Gulf coasts in the last century.1 In the next century, however, rising atmospheric and ocean temperatures are likely to expand ocean water and melt glaciers, and thereby accelerate the rise in sea level. By the end of the 21st century, global average sea level is likely to be rising 1.59.7 mm/yr even if polar ice sheets do not begin to disintegrate, according to the Intergovernmental Panel on Climate Change.2 Additional contributions from the Greenland and Antarctic ice sheets could be negligible or add as much as 4 mm/yr.3 Because of regional subsidence, sea level has risen, and almost certainly will continue to rise, 12 mm/yr more rapidly than the global average along the mid- Atlantic Coast.4 Thus, by 2100, sea level could be rising 316 mm/yr.5 Over the next century sea level is expected to rise 30 to 90 cm (1 to 3 feet) along the mid-Atlantic coast.6
Rising sea level inundates low-lying lands, erodes shorelines, exacerbates flooding, and increases the salinity of estuaries and aquifers. The ramifications can be broadly divided into two categories: the human impact and the environmental impact. The human impacts include flood damages, land and structures lost to the sea, costs of protecting land and structures from the sea, the indirect economic and human toll from the migration necessitated by the entire loss of a community, and the costs of shifting to alternative water supplies when the original supply becomes saline.
This collection of papers focuses on some of the environmental impacts of sea level rise on the mid-Atlantic Coast of the United States. All but two of these papers were prepared to support a forthcoming report by the United States Climate Change Science Program entitled Coastal Elevations and Sensitivity to Sea Level Rise.
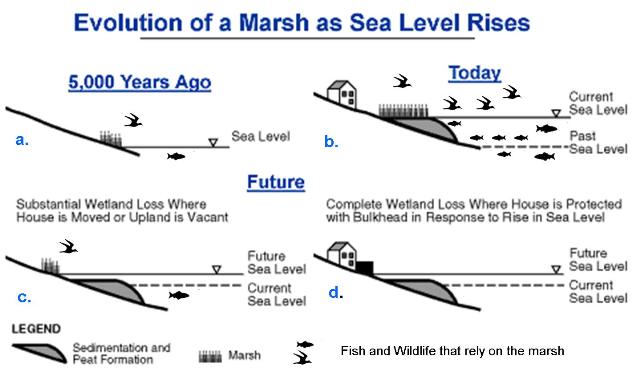 Figures ad provide an overview of the primary
environmental impact examined by this report.
Tidal wetlands are found where the elevation of
the land is between high and low tides, with
tidal marshes generally above mean sea level
and tidal flats below mean sea level.
(a) When
sea level was rising rapidly, tidal wetlands
would tend to be a narrow fringe along the
shore, determined by the slope of the land. But
wetlands have been able to keep pace with the
relatively slow rate of sea level rise during the
last several thousand years. As sea level rose,
new wetlands would form inland; but the
seaward boundary of tidal wetlands did not
retreat to the same extent, and the area of tidal
wetlands increased. (b) Today, the area of tidal
wetlandsi.e., the land between the high and
low tide shorelinesis much greater than the
amount of dry land within a similar elevation
range above the high tide shoreline. But there is
a limit to the rate of sea level rise with which
tidal wetlands can keep pace. (c) And if the sea
rises more rapidly, most of the existing tidal
wetlands will be lost, and the total area of tidal
wetlands will decline to the narrow fringe
determined by the slope. (d) Finally, in places
where developed lands along the shore are
protected from tidal inundation, new wetlands
may not form inland and almost all tidal
wetlands may be lost. Because the tidal
wetlands support fish and wildlife, a loss of
tidal wetlands could cause populations of birds
and fish to decline or relocate.
Figures ad provide an overview of the primary
environmental impact examined by this report.
Tidal wetlands are found where the elevation of
the land is between high and low tides, with
tidal marshes generally above mean sea level
and tidal flats below mean sea level.
(a) When
sea level was rising rapidly, tidal wetlands
would tend to be a narrow fringe along the
shore, determined by the slope of the land. But
wetlands have been able to keep pace with the
relatively slow rate of sea level rise during the
last several thousand years. As sea level rose,
new wetlands would form inland; but the
seaward boundary of tidal wetlands did not
retreat to the same extent, and the area of tidal
wetlands increased. (b) Today, the area of tidal
wetlandsi.e., the land between the high and
low tide shorelinesis much greater than the
amount of dry land within a similar elevation
range above the high tide shoreline. But there is
a limit to the rate of sea level rise with which
tidal wetlands can keep pace. (c) And if the sea
rises more rapidly, most of the existing tidal
wetlands will be lost, and the total area of tidal
wetlands will decline to the narrow fringe
determined by the slope. (d) Finally, in places
where developed lands along the shore are
protected from tidal inundation, new wetlands
may not form inland and almost all tidal
wetlands may be lost. Because the tidal
wetlands support fish and wildlife, a loss of
tidal wetlands could cause populations of birds
and fish to decline or relocate.
Examining the magnitude of this environmental impact requires us to address four questions, which are enumerated in the prospectus7 for Coastal Elevations and Sensitivity to Sea Level Rise:
- How much dry land is immediately above the tides and hence potentially available for the creation of new wetlands (wetland migration) as sea level rises? (prospectus question 1)
- To what extent would human activities encourage or allow the wetland migration or stop the wetland
migration with "shore protection"
structures designed to protect existing land uses that require the land to remain dry?
(prospectus question 4)
- To what extent can existing tidal wetlandsespecially the vegetated wetlandskeep pace with rising sea level? (prospectus question 3)
- Which species depend on the tidal wetlands that are potentially at risk if sea level rises? (prospectus question 8)
In Section 1.1, Titus and Wang evaluate the first question. They collected the best available topographic information as well as data on tides and wetlands. Based on standard interpolation methods, they create maps of lands depicting elevations relative to spring high water, that is, the average elevation of the high tides during full and new moons. Because tidal wetlands generally extend up to approximately spring high water, those maps provide elevations relative to the upper boundary of tidal wetlands. Finally, they quantify the area of lands close to sea level. In Section 1.2, Jones and Wang provide additional details on the Titus and Wang approach to quantifying the area of land close to sea level by interpolation. This paper also explains the authors approach to extending that type of analysis to include forthcoming data sets on shore protection and the vertical accretion of wetlands. Finally, Titus and Cacela estimate uncertainty ranges for the results developed in the previous two sections.
The second question is examined in detail in the companion report The Likelihood of Shore Protection.8Chapter 2 has two papers that examine the ability of wetlands to keep pace with rising sea level through mechanisms collectively known as wetland accretion. Section 2.1, by Reed et al., is the heart of the analysis: a panel assessment of the potential for wetland accretion in the mid-Atlantic from the south shore of Long Island to Virginia Beach. (They excluded North Carolina because the wetland accretionary processes are very different there.) This paper describes wetland accretionary processes and how they vary across different geomorphic settings. It also contains the panels assessment of the potential for future wetland accretion. In Section 2.2, Titus, Jones, and Streeter generate GIS data and a set of maps to succinctly summarize the results of the Reed et al. analysisand document a data set available for other researchers interested in modeling changes in mid-Atlantic wetlands. (The complete set of maps appears in Section 2.1 instead of 2.2 to facilitate the discussion of the various mid-Atlantic subregions.)
This report does not quantitatively integrate the results from the separate studies. (Such an analysis is included in the Likelihood of Shore Protection.) However, each of the three studies answering the first three questions conveyed their final results as maps. Even an informal examination of the three sets of maps shows that accelerated sea level rise is likely to cause a loss of intertidal habitat, with higher rates of sea level rise causing a correspondingly greater loss of habitat. What are the consequences?
Ideally, we would develop an ecological model of the impacts of habitat loss throughout the mid-Atlantic as sea level rises. Given time and resource constraints, we had to limit our modeling to a single county and provide more qualitative descriptions for the rest of the region. Chapter 3 presents 20 papers that examine the species that depend on the vulnerable habitats. In Section 3.1, Jones and Bosch present an overview of the habitats that could be altered or lost as a result of sea level rise and the animal species found in these habitats, with emphasis on tidal marshes, estuarine beaches, tidal flats, and submerged aquatic vegetation. Eighteen brief literature reviews follow, each discussing the coastal ecosystems of a multicounty coastal region. These papers focus on the animals that depend on the vulnerable habitats for food, shelter, spawning, or nursery areas. Although it was not possible to discuss every bay, river, or tidal creek, we examine a representative sample. Five locator maps8 show the specific areas that these papers discuss. Finally, Section 3.20 is a modeling study, which quantifies the impact of sea level rise and six scenarios of shore protection on the fish and bird species that inhabit Barnegat Bay and the smaller estuaries adjacent to Long Beach Island, New Jersey. This pilot study quantitatively integrates the three questions addressed by this report.
Chapters 1 and 2 are mapping assessments that rely mostly on published data and peer-reviewed scientific literature. Chapter 3, however, relies on a more diverse group of sourcesincluding web sites, and emails and oral statements from experts. These types of sources are necessary because, in most cases, there is no peer-reviewed journal article that addresses the presence of a particular species at a particular location. Nevertheless, as long as an author reviews the reliability of a source, these more informal sources can be just as useful as a published scientific article. For example, an individual making a general statement about environmental vulnerability may not be as reliable as a peer-reviewed article doing the same thing; but a refuge manager stating species of birds that she has personally seen on her refuge would generally be at least as reliable as a journal article that mentioned that particular refuge in passing. In every case where these papers rely on a source that is not a peer-reviewed report, the footnote documenting the source includes enough information for a reader to understand the authors basis for assuming that the source is reliable for the fact cited.
Taking all of these studies together, Chesapeake Bay appears to be on the brink of a major loss in habitat with even a small increase in the rate at which sea level rises--and most saline and brackish wetlands are vulnerable if sea level rises more than 10 mm/yr. Given the role of tidal wetlands in the overall estuarine food web, one would expect a substantial impact on estuarine species-but we know too little to articulate those impacts. In shallow water areas, deeper water will reduce light penetration, which can inhibit the growth and survival of submerged aquatic vegetation; whether these areas can transgress inland onto current marsh areas that become inundated is unknown. and depends on a variety of physical factors. Although beds of submerged aquatic vegetation play a critical role as nursery and food source for many fish and other aquatic species, we do not know the extent of consequences of the loss of submerged vegetation for these species similarly, the impacts of substantial marsh loss on the species that feed on the fish that directly rely on the marsh are not quantified.
The impact on birds is also unclear: Some species may be able to move inland to nest and find foodbut perhaps only if nearshore farms, forests, and nontidal wetlands are not consumed by coastal development. Changing migration patterns with a warmer climate and shifts in estuarine species composition with warmer water temperatures are further confounding factors. Nevertheless, some species are clearly vulnerable, such as the horseshoe crab, which relies on estuarine beaches to reproduceand the many migratory bird species that depend on horseshoe crab eggs to refuel during their long-distance migrations.
Our inability to forecast how complex animal communities respond to habitat loss as sea level rises need not obscure the importance of the few things that we do know. For several decades, the importance of tidal habitats has prompted governments and private conservancies to preserve coastal wetlands and shallow water habitats. Rising sea level threatens these habitats, and an accelerated rise is likely to eliminate much of it. This report identifies many animal species that will be forced to adapt to the impacts of rising sea level. How they might adapt and what managers might do to increase the likelihood of successful adaptations are outside the scope of this report. We hope that this collection of papers helps motivate the research needed to answer those questions.
Footnotes
1. See, e.g., Zervas, C.E., 2001, Sea Level Variations of the United States 18541999, NOAA Technical Report NOS CO-OPS 36, Silver Spring, MD: National Oceanic and Atmospheric Administration.2. IPCC at Table 10.7; Meehl, G.A., T.F. Stocker, W.D. Collins, P. Friedlingstein, A.T. Gaye, J.M. Gregory, A. Kitoh, R. Knutti, J.M. Murphy, A. Noda, S.C.B. Raper, I.G. Watterson, A.J. Weaver and Z.-C. Zhao, 2007, Global Climate Projections. In: Climate Change 2007: The Physical Science Basis. Contribution of Working Group I to the Fourth Assessment Report of the Intergovernmental Panel on Climate Change, Solomon, S., D. Qin, M. Manning, Z. Chen, M. Marquis, K.B. Averyt, M. Tignor and H.L. Miller (eds.), United Kingdom and New York: Cambridge University Press, Cambridge.
3. Ibid.
4. See, e.g., Titus, J.G. and V. Narayanan, 1996, The Probability of Sea Level Rise, Washington, DC: U.S. Environmental Protection Agency, at chapter 9 (discussing methods for projecting relative sea level rise when given projections of global sea level rise).
5. The global rate would be 1.513.6 mm/yr; IPCC at Table 10.7 (adding sea level rise to scaled up ice charge). Ibid.
6. The global rise would be 1977 cm. Ibid.
7. Available at http://www.climatescience.gov/Library/sap/sap4-1/sap4-1prospectus-final.htm
8. These four reports all provide products promised in the CCSP Strategic PlanSee Climate Change Science Program. 2003. Strategic Plan for the U.S, Climate Change Science Program at page 97. Based on that plan, CCSP proposed a set of "synthesis and assessment products" including Coastal Elevations and Sensitivity to Sea Level Rise. See CCSP 2003. The U.S. Climate Change Science Program: Vision for the Program and Highlights of the Scientific Strategic Plan at page 3 and 20.