Recent Sea Level Trends
 |
|
| Figure 1: U.S. Sea Level Trends Source: Monthly and Annual Mean Sea Level Station Files from the Permanent Service for Mean Sea Level (PSMSL) at the Proudman Oceanographic Laboratory |
Sea levels are rising worldwide and along much of the U.S. coast. (IPCC, 2007) Tide gauge measurements and satellite altimetry suggest that sea level has risen worldwide approximately 4.8-8.8 inches (12-22 cm) during the last century (IPCC, 2007). A significant amount of sea level rise has likely resulted from the observed warming of the atmosphere and the oceans.
According to the Intergovernmental Panel on Climate Change (IPCC), the primary factors driving current sea level rise include:
- the expansion of ocean water caused by warmer ocean temperatures
- melting of mountain glaciers and small ice caps
- (to a lesser extent) melting of the Greenland Ice Sheet and the Antarctic Ice Sheet
Other factors may also be responsible for part of the historic rise in sea level, including the pumping of ground water for human use, impoundment in reservoirs, wetland drainage, deforestation, and the melting of polar ice sheets in response to the warming that has occurred since the last ice age.
Considering all of these factors, scientists still cannot account for the last century's sea level rise in its entirety. It is possible that some contributors to sea level rise have not been documented or well-quantified.
The rate of sea level rise increased during the 1993-2003 period compared with the longer-term average (1961-2003), although it is unclear whether the faster rate reflects a short-term variation or an increase in the long-term trend. (IPCC, 2007)
While the global average sea level rise of the 20th century was 4.4-8.8 inches, the sea level has not risen uniformly from region to region.In the United States:
- Sea level has been rising 0.08-0.12 inches per year (2.0-3.0 mm per year) along most of the U.S. Atlantic and Gulf coasts.
- The rate of sea level rise varies from about 0.36 inches per year (10 mm per year) along the Louisiana Coast (due to land sinking), to a drop of a few inches per decade in parts of Alaska (because land is rising). See Figure 1 for sea level trends in selected cities.
For an interactive map showing sea level trends throughout the U.S., visit NOAA's Sea Levels Online (or by clicking the graphic below).

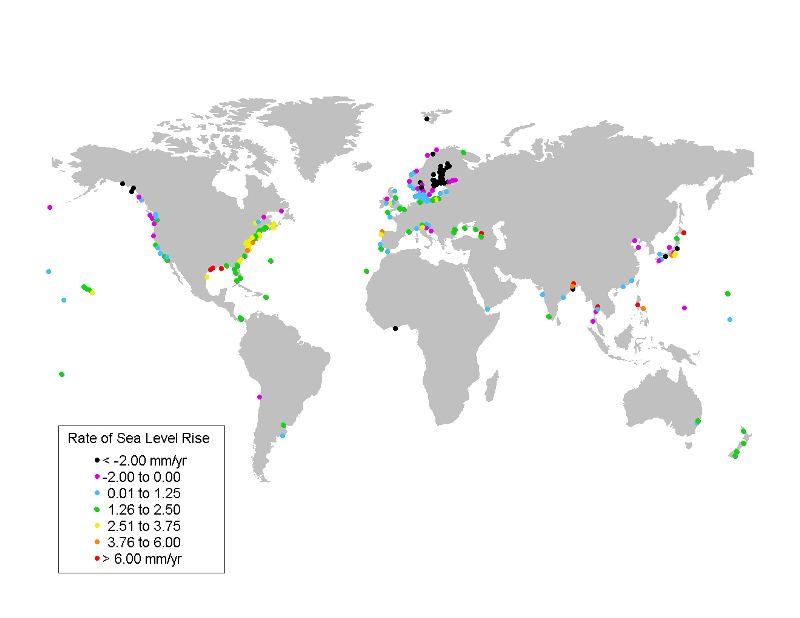
Globally (IPCC, 2007):
- Indonesia, Thailand, and Bangladesh are experiencing above-average sea level rise.
- Northwestern Australia is experiencing below-average sea level rise, a trend that is evident in much of the ocean between western Australia and East Africa.
- Most of the Pacific and Atlantic basins are experiencing average to above-average sea level rise.
- Many coastal areas outside of the U.S., Europe and Japan have too few tide gauges to be sure about long-term trends in regional sea level rise.
 |
|
| Figure 2: Global Sea Level Trends Source: Titus and Wang 2008 (using data from the Permanent Service for Mean Sea Level) |
Is the rate of sea level rise accelerating?
- The IPCC expresses high confidence that the rate of observed sea level rise increased from the mid 19th to the mid 20th century. During the 20th century, sea level rose at an average rate of 4.8 to 8.8 inches per century (1.2-2.2 mm/year). (IPCC, 2007)
- Tide gauges show little or no acceleration during the 20th century.
- Satellite measurements estimate that sea level has been rising at a rate of 9 to 15 inches per century (2.4-3.8 mm/yr) since 1993, more than 50% faster than the rate that tide gauges estimate over the last century. (IPCC, 2007)
The Future Sea Level Rise page contains projections for future sea level rise.
References
- IPCC, 2007: Climate Change 2007: The Physical Science Basis. Contribution of Working Group I to the Fourth Assessment Report of the Intergovernmental Panel on Climate Change [Solomon, S., D. Qin, M. Manning (eds.)].