Maps of Lands Vulnerable to Sea Level Rise
North Carolina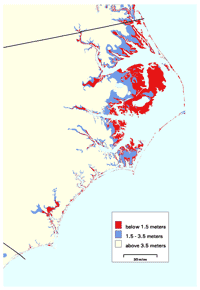 Download B&W Map (PDF, 2 pp, 223 KB) Download Color Map (PDF, 2 pp, 223 KB) |
South Carolina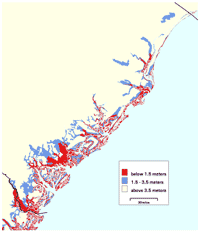 Download B&W Map (PDF, 2 pp, 244 KB) Download Color Map (PDF, 2 pp, 244 KB) |
| (Click on maps to see a larger image.) | |
Georgia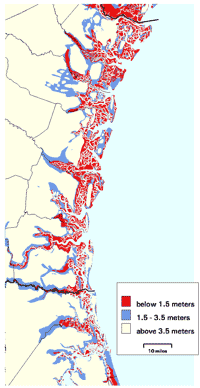 Download B&W Map (PDF, 2 pp, 190 KB) Download Color Map (PDF, 2 pp, 190 KB) |
Florida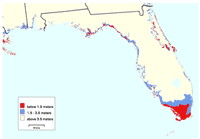 Download B&W Map (PDF, 2 pp, 295 KB) Download Color Map (PDF, 2 pp, 294 KB) |
| (Click on maps to see a larger image.) | |
Note: Elevations are based on computer models, not actual surveys. Coastal protection efforts may prevent some low-lying areas from being flooded as sea level rises. The 1.5-meter contour depicted is currently about 1.3-meters above mean sea level. Therefore, some of the areas depicted in red will be above mean sea level for at least 100 years and probably 200 years. Nevertheless, because mean spring high water (i.e., high tide during new and full moons) is typically 60 cm above sea level, the 1.3-meter contour would be flooded a few times per month by a 70 cm rise in sea level.
Over the next century, sea level is most likely to rise 55-60 cm along most of the U.S. Atlantic and Gulf Coasts. The 3.5-meter contour roughly illustrates an area that might be flooded over a period of several centuries.
